Where You’ll Find Google Structured Snippets: From Superheroes To Product Specifications
The other day, Google officially announced structured snippets, basically knowledge graph snippets directly embedded in the search results snippets. But what type of queries trigger the structured snippets from showing up in the search results? Based o…
First Day Of Autumn From The Search Industry
Today is the first day of Autumn for many folks and to mark the day both Google and Bing have special things going on…
Google AdWords Merging Mobile Click Call Data
Google quietly announced on Google+ that they are combing/merging two different metrics into one metric on the mobile click front in order to appease the “feedback from hundreds of advertisers…
Report: Google Severely Hits PBNs (Private Blog Networks)
The black hat and gray SEO communities are buzzing about Google’s latest efforts to target PBNs, Private Blog Networks.
Over the past couple days, Google has reportedly went after many PBNs that are being used to manipulate their rankings…
Submit Your Google App Indexing Questions
Google has been trying to heavily promote App Indexing, we covered it here several times, it is basically a way for you to tell Google about content within an app and have it potentially be indexed and rank in Google’s search results…
Google Structured Snippets: Why Bother Clicking On The Results?
Yesterday, Google announced a feature they’ve been testing for a few weeks, Structured Snippets.
Structured Snippets is a form of knowledge graph that incorporates facts into individual result snippets in Web search results. It looks like this:
Responding to Device Changes in Google and Bing
Recently, both Bing and Google announced some changes to mobile advertising that you need to be aware of and react to within your PPC campaigns.
First Day Of Autumn Google Logo Reminds Us The Fall Season Is Here
Today’s Google logo marks the first day of the Autumnal Equinox with an animated doodle of trees that go from grey to branches filled with Fall-colored leaves dropping to reveal Google’s name. The logo is being served to most of Google’s Northern Hemisphere homepages, while…
Please visit Search Engine Land for the full article.
Google introduces ‘structured snippets’ into search results
You can see these snippets in action by Googling ‘Nikon D7100’. The middle result here contains data about resolution, weight and display size.

You can also see these snippets in action on a search for ‘Superman’, just in case anyone doesn’t know he’s from Krypton.

According to Google:
We use machine learning techniques to distinguish data tables on the Web from uninteresting tables, e.g., tables used for formatting web pages. We also have additional algorithms to determine quality and relevance that we use to display up to four highly ranked facts from those data tables.
Here’s the table on the dpreview page which Google has extracted the data from:

The listings with structured snippets do stand out a little bit more in the SERPs, but whether this be enough to increase CTR remains to be seen.
Google Market Share: 67 Percent On PC, 83 Percent In Mobile
Last week comScore released its August US search market share rankings report. It appears Google has permanently plateaued at 67 percent (or so). In Europe Google’s share is above 90 percent, which is why all the antitrust activity. Back in the US, Microsoft and Yahoo combined for 29 percent,…
Please visit Search Engine Land for the full article.
A Content Strategy Template You Can Build On
Posted by Isla_McKetta
Picture it. A room full of executives from a company you never thought you could land as a client. They’re so engaged in what they are saying that they’re leaning forward in their chairs. The CEO looks poised to ask a question but you can tell she doesn’t want to interrupt your flow.
This is the moment content strategists dream of.
But if you’re like me, it’s easy to get caught up in how new the field is and wonder, “Am I even doing this right?” There are lots of posts to help you, such as
How to Build a Content Marketing Strategy and Content Strategy: You’re Doing it Wrong. There are also comprehensive guides to creating content strategies. There’s even an epic list of content strategy resources. And there are books (my favorite is Kristina Halvorson and Melissa Rach’s Content Strategy for the Web).
Still, sometimes you just want to peek over someone else’s shoulder at a concrete example to see if there’s anything you can learn. This can be especially true if you’re working in-house and don’t have anyone to bounce ideas off of.
So, I built a
template.
What a content strategy should look like
Content strategies take many forms, from a 50-page word document to an hour-long PowerPoint presentation. That means this template is not meant to be gospel. Instead, it introduces you to the many moving parts that make up a content strategy and gives you an example of how I, based on the years I spent consulting on content strategies for everything from stock photography to software as a service, would write it up.
Peek over my shoulder to get your next strategy started, or just to get a glimpse of how someone else approaches a strategy. Build on this template and make it your own. You’ll find that the template is written from an agency perspective (with lots of references to “the client”) but it works equally well if you are in-house and are writing for that one, all-important client—your boss.
What goes into a content strategy
The content strategy template walks you through researching and writing up the three key elements of a content strategy: what content looks like now, what it should look like, and the ecosystem in which content is created.
Content today
A strategy should provide an assessment of the client’s current content, as well as insight into their competitors’ content. That assessment may include any or all of the following:
- Personas
- Stakeholder interviews
- Content inventory
- Content audit
- Gap analysis
- Competitive analysis
Content in the future
Then you want to show your client where the content should take them and how they can use various channels to get there. Some of
many places content resides are:
Onsite content
- Homepage
- Landing pages
- Category pages
- Product descriptions
- Blog
- Error pages
- Etc.
Offsite content
- Emails
- Social media
- Brochures
- Packaging
- Invoices
- Voicemail messages
- Etc.
Governance (aka the content ecosystem)
Finally, you want to think about the environment in which the content gets created—the governance of content. This includes:
- Brand, voice, and style guidelines
- Workflow analysis
- Best practices for writing on the web
- SEO tips
- Editorial calendar
See the template for more in-depth descriptions of all of these elements as well as some of my favorite tools to get them done.
Again, take these pieces and use them to create your own template. Each strategy you do will require its own tweaks, but this will give you the leg up to put your own stamp on this emerging field.
The storytelling of content strategy
My brand of content strategy, and you’ll see this reflected a little in the template, is that a content strategy is a story. For a deeper understanding of this, check out the Mozinar I gave a few weeks ago,
The Storytelling of Content Strategy.
Basically, I advocate for taking the elements of fiction and using them to get a fresh perspective on a brand’s journey toward a goal.
Here’s how the five elements of a story are also the basis of a content strategy:

1. Brands and customers are heroes
A content strategy can either be about a brand’s journey to land a customer (useful when a brand is new or has lost its way), or a content strategy can be about a customer’s journey and how the brand can help. See the webinar for an example of each.
2. Your current landscape is your ground situation
You can’t start a strategy until you know where your hero is coming from. Most of the initial research you do—from
stakeholder interviews to content inventories and audits—is to understand the starting point of your strategy. This is where the journey begins. You will be measuring all future success against the understanding you build of this landscape.
3. Goals articulate your central desire
You can’t plot a strategy if you don’t know what direction the brand wants to grow. Goals should come from the brand itself, but you might find that the brand needs a little coaching. It’s helpful if you distinguish overall business goals from content goals. They are related, but there are some goals (e.g. reducing employee turnover) that content plays a much smaller role in achieving. Setting specific goals for your content strategy also lets you get more granular about some goals in which content is the star player (e.g. increasing email open rate).
4. Competitors are antagonists
Even if you’re going to write the most TAGFEE content strategy ever, you still need to figure out where your competitors are and how you can learn from their example. And it’s important to remember that because of the way search engines work, your business competitors might be different than your SERP competitors. Ideally a content strategy will address both.
5. Plot is strategy
At this point in the story, you know who the players are, what’s working and what’s not, and have some ideas about how to move forward to achieve those goals.
When I write up a strategy, I think about them as though I were plotting a novel. Each tactic or channel is a way to move the brand closer to those goals. What obstacles might they encounter? Who are they competing with in the space? How can they master this tactic or channel? And how can content help them achieve their goals and ride happily off into the sunset?
Making a content strategy your own
Now it’s time to
download that template and see what story your content strategy is trying to tell. Once you’re confident in the strategy you’re presenting, you’ll have the complete attention of every executive in that conference room. And, with any luck, they’ll refer you to their friends.
I want to learn from you, too. Is there anything you’d include in the template that I haven’t covered? Do you have any strategies for success in presenting content strategies or any lessons learned? Please share your ideas and stories in the comments.
Sign up for The Moz Top 10, a semimonthly mailer updating you on the top ten hottest pieces of SEO news, tips, and rad links uncovered by the Moz team. Think of it as your exclusive digest of stuff you don’t have time to hunt down but want to read!
SearchCap: Google Structured Snippets, DuckDuckGo Blocked In China & Ask.com Arbitrage
Below is what happened in search today, as reported on Search Engine Land and from other places across the web. From Search Engine Land: Will Ask.com Google Arbitrage Ever Stop? Google has been steadily cracking down on sites with poor quality content,…
Bing Ads Reveals Dynamic Sitelinks
Bing Ads has revealed a new feature dubbed “dynamic sitelinks” which creates annotations for ads that haven’t specifically set up sitelink extensions.
Google My Business Insights Bug?
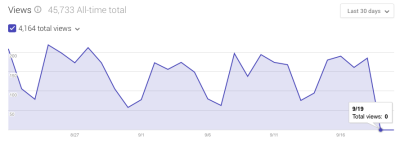 There is apparently a new bug that is impacting the reporting of listing/profile views in the GMB Insights dash. According to GMB, this client’s views flatlined for 9/19 & 9/20: If I were a business owner this GMB Insights graph would freak me out. However, thanks to campaign tagging we can see that Google Analytics is […]
The post Google My Business Insights Bug? appeared first on Local SEO Guide.
Will Ask.com Google Arbitrage Ever Stop?
Google has been steadily cracking down on sites with poor quality content, both on the organic and the paid side. So why does Ask.com continue to get away with it, and what’s it getting out of the relationship?
The post Will Ask.com Google Arbitrage …
Google Structured Snippets Officially Live In Search Results
Earlier this month we caught Google testing a form of knowledge graph data within the search results snippet. This feature is now officially being confirmed by Google on the Google Research Blog. Google calls these “structured snippets,” where Google will show snippets of data, relevant…
Please visit Search Engine Land for the full article.
“An improved box within search results” rolled out… Still not good news for publishers
By searching “thesaurus.com” in Google, you can now search synonyms
read more
Sam Noble: State of Digital Summer School, Learning from the Experts
What things do you need to learn to become an expert in Digital Marketing? Experts are telling you. Here Sam Noble talks about education in Digital.
Post from Bas van den Beld on State of Digital
Sam Noble: State of Digital Summer School, Learning from the Experts
How to use Keyword Research to Find New Landing Page Testing Ideas
Marketers can use competitive keyword research in part to find more profitable keywords, improve their ad copy and come up with A/B testing ideas.
Understanding Sales, Conversion & Revenue For Local SEO Agencies
Contributor Myles Anderson takes a deep dive into the stats BrightLocal collected in a survey of more than 1,700 local SEOs.
The post Understanding Sales, Conversion & Revenue For Local SEO Agencies appeared first on Search Engine Land.
Please v…